I saw this on my blog friend, Mari's blog, Mari's Little Corner, and had to copy it here on Penless Writer.
HOW AWESOME IS THIS?!!!!!!
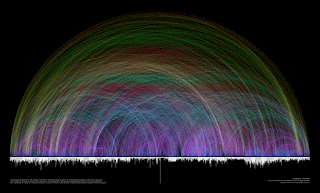
Named one of the best science images by the National
Geographic News, Visualizing the Bible "... brings to light the
interconnected nature of one of the world's most familiar books." The bar graph
that runs along the bottom represents all of the chapters in the Bible. Books
alternate in color between white and light gray. The length of each bar denotes
the number of verses in the chapter. Each of the 63,779 cross references found
in the Bible is depicted by a single arc - the color corresponds to the distance
between the two chapters, creating a rainbow-like effect.
This print is a fine art giclee. It is printed on high-quality, premium
lustre photo paper.
This chart was created by Chris Harrison, a Ph.D. student in the
Human-Computer Interaction Institute at Carnegie Mellon University, in
collaboration with Christoph Römhild, a Lutheran Pastor. Chris won the Honorable
Mention in the NSF's Science & Engineering 2008 Visualization Challenge.


4 comments:
I thought this was so amazing! Seeing all the connections in front of you is awe inspiring. I also thought it shows what an orderly God we serve!
Looks lovely.
We have just been watching the Indescribable DVD's - Hubble photo's-again.
How beautiful and touching really, Thank you so much for sharing it. Susan, thank you so much for your comments from time to time on my blog. They are always a blessing. love you, connie
Yep, this is absolutely amazin', upliftin' and fun too!!!
God bless ya and have a fantastic weekend sweetie!!! :o)
Post a Comment